
Delivery and operations
DORA Metrics
DORA metrics interpreted as flow, feedback and operational friction signals rather than a scoreboard for engineering teams.
Platform Clarity perspective
The operational reading
DORA metrics are useful when they reveal flow and feedback. They become dangerous when leaders use them as a scoreboard divorced from architecture, governance and operational context.
Related operational concepts
- operational flow
- delivery friction
- feedback loops
- change failure clustering
- measurable resilience
Observable signals
- deployment frequency
- lead time for changes
- change failure rate
- failed deployment recovery time
- approval latency
- escaped defect clustering
When this becomes harmful
- teams game the numbers
- change size shrinks without value improving
- quality work is hidden
- metrics are compared across unlike operating contexts
Operational scenario
A leadership team sees improving delivery velocity but customer defects and release anxiety are rising. DORA review separates healthy flow improvement from metric gaming, hidden rework and governance pushed too late in the delivery path.
AI governance thread
AI-assisted delivery will make speed easier to increase, which makes flow evidence and failure signals more important rather than less.
Signals & failure patterns
What to look for before confidence becomes fragile.
These are not scorecards by themselves. They are review prompts: signs that flow, trust, governance or operational understanding may be degrading under pressure.
Failure patterns
- metric gaming
- local optimisation
- delivery theatre
- change slicing without value improvement
Pressure indicators
- lead time variance
- deployment friction
- rollback clustering
- change failure concentration
Confidence erosion
- speed improves while outcomes worsen
- failures are redefined away
- comparisons ignore operating context
From theory to operating reality
What changes under pressure
DORA becomes operationally useful when it explains flow and recovery. It becomes harmful when numbers replace interpretation and teams optimise the signal rather than the system.
Knowledge graph
Read this with the neighbouring disciplines.
Platform Clarity treats each topic as part of an operating model: controls change flow, flow creates evidence, evidence changes governance, and governance must survive delivery pressure.
Visual pattern: Delivery flow overlay showing queues, review gates, failure clusters and recovery feedback loops.
Introduction
DORA metrics help organisations see how software delivery behaves under real conditions. Deployment frequency, lead time for changes, mean time to restore and change failure rate are useful because together they reveal flow, feedback and operational friction.
Why It Exists
The problem DORA addresses is not a lack of engineering activity. It is the difficulty of knowing whether change can move safely and quickly through the organisation. These metrics create a shared evidence base for conversations that otherwise become opinion, optimism or blame.
Historical Context
DORA emerged from research into high-performing technology organisations and DevOps practice. Its historical importance is that it moved the conversation away from local productivity measures towards system outcomes: how reliably a team can deliver and recover.
Core Principles
- Deployment frequency shows whether change can move in small batches.
- Lead time shows how long work waits between idea, implementation, review and release.
- MTTR shows whether the organisation can restore service under pressure.
- Change failure rate shows whether speed is being bought by pushing instability downstream.
Operational Interpretation
In operational terms, DORA Metrics should change how people make decisions. It should influence review questions, design constraints, evidence expectations and escalation paths. If it only appears in policy documents, architecture packs or procurement questionnaires, it has not yet become part of the operating system of the organisation.
Common Misunderstandings
- Using the metrics as a league table between teams with different risk profiles.
- Optimising deployment frequency while ignoring reliability and user impact.
- Treating MTTR as an operations metric rather than a whole-system recovery signal.
Common Failure Modes
- Teams game metrics by splitting work artificially or changing definitions.
- Manual approval gates inflate lead time but are not visible as a governance cost.
- Incidents are restored technically but not reviewed organisationally.
- Change failure data is hidden because teams fear punishment.
Relationship To Other Frameworks
DORA Metrics rarely stands alone. It connects to the surrounding operating model because platforms are made of governance, delivery, security, data, people and evidence. The related topics below should be read as neighbouring disciplines rather than optional extras.
Practical Organisational Examples
- A SaaS team discovers that lead time is dominated by waiting for security approval, not coding time, so governance is redesigned into earlier threat review and automated evidence.
- A regulated platform keeps low deployment frequency deliberately for high-risk components but improves recovery rehearsals and change failure visibility.
- A product group with frequent releases finds customer-facing defects rising, showing that speed has outpaced testing and observability.
Worked Scenario
A delivery director sees that teams are busy and sprint reports are green, yet customers wait months for small changes. DORA metrics reveal that coding takes days, but changes wait in review queues, test environments and release approvals. Deployment frequency is low because releases are bundled. Change failure rate is high because bundled releases are hard to understand when something breaks.
The useful intervention is not to tell developers to go faster. It is to reduce batch size, remove avoidable waiting, improve automated evidence and strengthen rollback. DORA turns the conversation away from individual productivity and towards the operating system around delivery.
Governance Implications
Governance should use DORA as a diagnostic, not a target board. The useful question is where the system creates delay, fear, rework or hidden risk, and whether controls are improving flow or merely moving liability.
Delivery/Engineering Implications
Engineering teams can use DORA to locate friction: queue time, review bottlenecks, brittle environments, slow builds, poor rollback, weak observability or unclear ownership. The metrics are most useful when discussed with the people doing the work.
Architecture Implications
Architecture affects DORA directly. Coupled systems, shared databases, fragile release trains and unclear service ownership all reduce flow. Modular architecture, good boundaries and observable services make smaller, safer changes possible.
Evidence And Implementation Notes
DORA metrics become useful when they are attached to a real delivery path. Deployment frequency should be measured against actual production releases. Lead time should expose waiting time, review time and rework, not only coding duration. Failed deployment recovery time should connect to incident handling and rollback capability. Change failure rate should be discussed without blame, otherwise teams will quietly redefine failure away.
The most useful review conversation is not whether the numbers are good. It is where the system creates friction. A team with low deployment frequency may be working in a high-risk regulated environment, or it may be trapped behind manual approvals and brittle release tooling. The metric opens the investigation; it does not finish it.
Where DORA is used maturely, it is paired with architecture review, observability quality and team-level retrospectives. That prevents the metrics becoming a scoreboard and keeps them focused on flow, recovery and operational learning.
Trade-offs And Tensions
DORA metrics create useful tension between speed and stability. A team can increase deployment frequency by slicing work better, but it can also increase it by pushing smaller defects into production. Lead time can improve because the system is healthier, or because assurance has been weakened. That is why the metrics must be read together.
There is also tension between comparability and context. Leaders often want one set of numbers across all teams, but a public website, a payments platform and a safety-related operational system do not carry the same risk. Comparisons are still useful, but only when the operating context is visible. Otherwise the metric becomes a league table and teams start defending themselves rather than improving the system.
The most difficult tension is psychological. Change failure rate and recovery time can expose uncomfortable delivery patterns. If the organisation uses the data to blame teams, the data will become less honest. DORA depends on a culture that can discuss failure as system evidence.
Implementation Pattern
Begin by agreeing definitions. What counts as a deployment? When does lead time start? What counts as a failed change? How is recovery measured when a customer workaround is available but the technical fix arrives later? These definitions do not need to be perfect on day one, but they need to be stable enough for trend analysis.
Next, map the value stream. Identify where work waits, where decisions queue, where evidence is manually assembled and where defects escape. DORA metrics should then be connected to specific improvement experiments: smaller batch sizes, automated release evidence, better test environments, feature flags, clearer ownership or improved rollback.
Avoid launching DORA as a dashboard project. The dashboard is the least important part. The operating rhythm matters more: regular review, team involvement, qualitative explanation and action tracking.
What To Measure
Measure the four core metrics, but also capture interpretation notes. Deployment frequency, lead time, failed deployment recovery time and change failure rate should be paired with release size, approval waiting time, incident themes, rollback success and customer-impact signals.
Good measurement shows whether improvement is real. If lead time improves while change failure rises, the organisation may be moving risk downstream. If recovery time improves but incidents increase, reliability may still be deteriorating. If deployment frequency remains low because assurance is manual, the constraint may sit in governance rather than engineering.
When This Becomes Urgent
DORA becomes urgent when delivery confidence is mostly anecdotal. Leaders may hear that teams are agile, releases are regular or incidents are under control, but without flow and recovery evidence the organisation cannot tell whether change is actually healthy.
The need is strongest during scaling, platform modernisation, DevOps transformation, acquisition integration or reliability improvement. Review evidence should show how long work waits, how often change reaches production, how often change harms users and how quickly service is restored. If those answers are unavailable, delivery performance is being managed by story rather than evidence.
What Mature Organisations Do Differently
Mature organisations combine DORA with qualitative review. They ask why a metric moves, whether the definition is stable and what operational behaviour sits behind the number.
Where Smaller Organisations Should Simplify
Smaller organisations should start with a lightweight monthly review: how often did we deploy, how long did changes wait, how quickly did we restore, and which changes hurt customers?
Operational Review Questions
- What decision is DORA Metrics meant to improve in this organisation?
- Which piece of evidence would show that it is working during normal delivery, not only during review?
- Where would teams work around it if deadlines compressed, an incident escalated or a supplier pushed back?
- Which exception would become dangerous if it quietly became normal practice?
- Which neighbouring topic changes the answer: Operational Flow, Observability, Operational Governance?
Signals To Look For
A useful review looks for behaviour, not only artefacts. The strongest signal is usually not whether DORA Metrics is named in a policy, but whether it changes prioritisation, design, access, release, recovery or escalation. Look for repeated delays, unclear ownership, manual workarounds, unmanaged exceptions, untested assumptions and evidence that only appears when an audit or executive review is imminent.
The second signal is proportionality. Weak organisations either ignore the topic until something breaks or turn it into a heavy process that teams route around. Stronger organisations know where the topic matters most, where a lighter control is enough and where additional evidence is justified by risk.
Diagram Concept
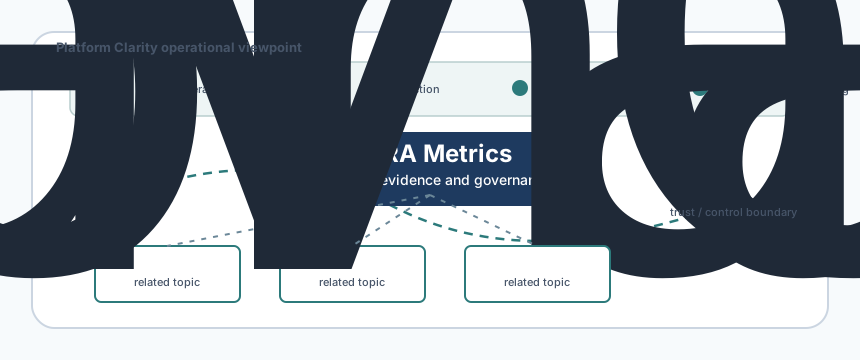
The current topic diagram is a relationship map. A mature diagram for this page should show the operating boundary created by DORA Metrics: the decision points, ownership handovers, evidence loops, escalation routes and related concepts that make the idea inspectable. The visual should help a leader ask better questions and help an engineer understand what changes in delivery.
Related Topics
Start with Operational Flow, Observability, Operational Governance. These relationships are deliberately practical: they show where this topic changes an adjacent architecture, governance or delivery conversation.
Further Reading
- DORA software delivery performance metrics
- DORA value stream mapping for software delivery
- DORA metrics history
- GOV.UK Service Manual: using performance data to improve your service
- GOV.UK Service Standard: define success and publish performance data
- Platform Clarity topics: Operational Flow, Observability, Operational Governance
