
Operational visibility
Observability
Observability as the ability to understand system and operational behaviour from evidence rather than reassurance.
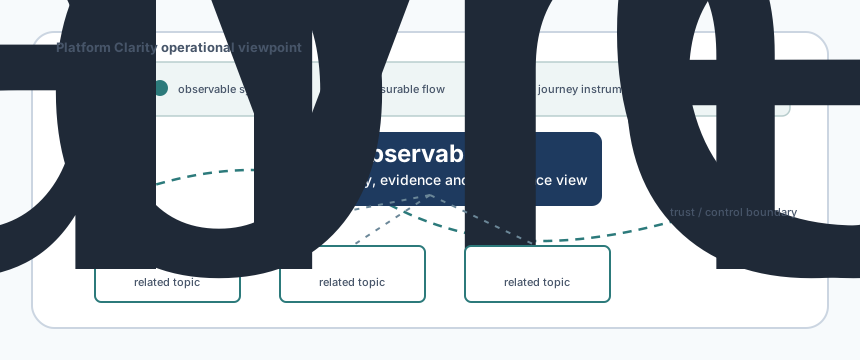
Platform Clarity perspective
The operational reading
Observability is not a dashboard estate. It is the ability to ask better questions under uncertainty and get evidence quickly enough to protect users, delivery and executive confidence.
Related operational concepts
- observable systems
- measurable flow
- journey instrumentation
- operational evidence
- feedback loops
Observable signals
- critical journey coverage
- unknown failure rate
- alert-to-owner latency
- deployment marker coverage
- business event instrumentation
- incident explanation time
When this becomes harmful
- telemetry volume replaces understanding
- nobody owns investigation
- dashboards reflect infrastructure but not outcomes
- AI workflows produce decisions without traceability
Operational scenario
Dashboards show the platform is healthy, but nobody can explain why an important customer journey failed after release. Observability review connects infrastructure signals, product behaviour, deployment markers and outcome evidence.
AI governance thread
AI workflows need observability across prompts, retrieval, tools, outputs, human review and downstream decisions because failure may look like plausible behaviour rather than a technical fault.
Signals & failure patterns
What to look for before confidence becomes fragile.
These are not scorecards by themselves. They are review prompts: signs that flow, trust, governance or operational understanding may be degrading under pressure.
Failure patterns
- dashboard theatre
- fragmented ownership
- telemetry without interpretation
- false confidence from infrastructure-only health
Pressure indicators
- unknown failure rate
- alert-to-owner latency
- MTTR growth
- incident explanation time
Confidence erosion
- dashboards stay green while user journeys fail
- teams cannot connect releases to outcomes
- incidents require archaeology
From theory to operating reality
What changes under pressure
Observability is the operating ability to ask better questions quickly. Under pressure, the useful test is whether evidence explains behaviour, ownership and impact before confidence collapses.
Knowledge graph
Read this with the neighbouring disciplines.
Platform Clarity treats each topic as part of an operating model: controls change flow, flow creates evidence, evidence changes governance, and governance must survive delivery pressure.
Visual pattern: Observability loop showing event, journey, impact, owner, decision and learning feedback.
Introduction
Observability is the ability to understand what a system is doing from the evidence it produces. In Platform Clarity terms, it also applies to operations: whether leaders can see the behaviour that creates risk.
Why It Exists
It exists because complex systems fail in ways that dashboards alone do not predict. Teams need logs, metrics, traces, events, audit trails and business signals that explain behaviour under pressure.
Historical Context
Observability comes from control theory and became central to modern software operations as distributed systems made simple monitoring insufficient.
Core Principles
- Telemetry should help answer unknown questions.
- Signals must be connected to ownership and action.
- Business and operational context matter as much as infrastructure metrics.
- Evidence should be available before, during and after incidents.
Operational Interpretation
In operational terms, Observability should change how people make decisions. It should influence review questions, design constraints, evidence expectations and escalation paths. If it only appears in policy documents, architecture packs or procurement questionnaires, it has not yet become part of the operating system of the organisation.
Common Misunderstandings
- Buying tooling and assuming observability exists.
- Collecting high volumes of telemetry nobody uses.
- Ignoring audit and business-process signals.
Common Failure Modes
- Incidents are visible only after customers complain.
- Dashboards show green while user journeys fail.
- Logs contain sensitive data and create new risk.
- Teams cannot correlate deployments, incidents and customer impact.
Relationship To Other Frameworks
Observability rarely stands alone. It connects to the surrounding operating model because platforms are made of governance, delivery, security, data, people and evidence. The related topics below should be read as neighbouring disciplines rather than optional extras.
Practical Organisational Examples
- A checkout platform adds trace correlation so teams can distinguish payment provider latency from application faults.
- A governance review uses audit evidence to show privileged access is being used outside expected change windows.
- A SaaS business connects product events to operational alerts so failures are prioritised by customer impact.
Worked Scenario
A customer journey fails intermittently, but infrastructure dashboards remain green. Support sees complaints, engineering sees normal service metrics and leadership sees no clear incident. The organisation has monitoring, but not enough observability to understand the behaviour.
The fix is not another generic dashboard. The team instruments the journey end to end, adds deployment markers, correlates supplier latency, captures business events and defines ownership for investigation. Observability becomes the evidence that lets people ask better questions during uncertainty.
Governance Implications
Governance should define what evidence is required for critical services and who reviews it.
Delivery/Engineering Implications
Engineering teams need instrumentation as part of design, not an afterthought.
Architecture Implications
Architecture should make observability paths explicit: telemetry, audit, ownership, retention and escalation.
Evidence And Implementation Notes
Observability evidence includes traces, metrics, logs, audit events, deployment markers, business events, service ownership and incident review outputs. The key question is whether the evidence helps people answer new questions during uncertainty, not whether a dashboard exists.
Implementation should start with critical journeys and failure modes. Instrumenting everything equally creates cost and noise. Instrumenting the checkout path, identity flow, payment route, supplier API, privileged access path or AI decision workflow can create much more operational value than broad but shallow telemetry.
Good observability also respects governance. Logs can leak secrets, metrics can create false confidence and alerts can train teams to ignore noise. The architecture must define what is collected, where it goes, who can see it, how long it lives and which decisions it supports.
Trade-offs And Tensions
Observability creates tension between visibility and noise. More telemetry does not automatically create better understanding. Teams can drown in logs and alerts while still being unable to explain customer impact or root cause.
There is also tension between operational evidence and privacy/security. Logs, traces and analytics events can contain sensitive information, identifiers or business details. Observability design must therefore include data minimisation, retention, access control and classification, not only instrumentation.
Cost is another practical tension. High-cardinality telemetry, long retention and broad tracing can become expensive quickly. Mature observability chooses depth where consequence is highest, rather than collecting everything forever.
Implementation Pattern
Start with critical user journeys and operational promises. Define what failure would look like, how it would be detected, who would investigate and which evidence would be needed. Then instrument the path end to end.
Add deployment markers, correlation IDs, business events and ownership metadata. These often turn disconnected signals into usable operational evidence. A metric without ownership can create awareness without action.
Review observability after incidents. Ask which questions were hard to answer, which signals were missing, which alerts were noisy and which evidence arrived too late. That review should drive instrumentation work.
What To Measure
Measure alert quality, time to detect, time to diagnose, unknown-cause incidents, dashboard usage, telemetry gaps on critical journeys, log sensitivity issues and incident questions that could not be answered.
Also measure decision usefulness. Observability should help teams decide whether to roll back, scale, fail over, contact a supplier, escalate to leadership or reassure customers. If it does not change decisions, it is not yet mature.
When This Becomes Urgent
Observability becomes urgent when the organisation cannot explain operational behaviour quickly enough to protect users, revenue or trust. Common triggers include repeated incidents with unclear cause, supplier disputes, platform scaling issues, customer-impact ambiguity, security investigations or leadership losing confidence in dashboard reporting.
The urgency is often discovered during an incident, but the work must happen before the next one. Teams need to know which journeys matter, which signals describe them, which logs can be trusted, which dashboards are noise and who owns each response. Otherwise every incident becomes a fresh investigation into both the system and the evidence.
Review evidence should include critical journey maps, telemetry coverage, alert rules, runbooks, incident timelines, deployment markers, ownership metadata, logging retention and post-incident learning. Observability is mature when it shortens uncertainty.
The first practical move is to choose one critical user journey and ask what evidence would explain failure in ten minutes. If the answer requires several teams, manual log searches and guesswork, instrumentation should be improved around that journey before adding broader dashboards.
Good observability changes the shape of an incident. People spend less time arguing about whether the problem is real, which component is responsible or whether customers are affected. They can move faster into containment, recovery and communication. That does not require perfect telemetry everywhere. It requires trusted evidence in the places where uncertainty is most expensive.
The review should include non-technical signals as well. Support tickets, customer complaints, failed journeys, payment drop-offs and manual workarounds may reveal platform behaviour before infrastructure metrics do. Mature observability connects technical telemetry with business impact.
That connection is what turns monitoring into operational judgement.
Without it, teams can be busy watching systems while users experience failure.
What Mature Organisations Do Differently
Mature organisations design observability around decisions and recovery, not tool coverage.
Where Smaller Organisations Should Simplify
Smaller organisations should instrument critical journeys first and keep alerting small enough to trust.
Operational Review Questions
- What decision is Observability meant to improve in this organisation?
- Which piece of evidence would show that it is working during normal delivery, not only during review?
- Where would teams work around it if deadlines compressed, an incident escalated or a supplier pushed back?
- Which exception would become dangerous if it quietly became normal practice?
- Which neighbouring topic changes the answer: DORA Metrics, Operational Flow, Operational Governance?
Signals To Look For
A useful review looks for behaviour, not only artefacts. The strongest signal is usually not whether Observability is named in a policy, but whether it changes prioritisation, design, access, release, recovery or escalation. Look for repeated delays, unclear ownership, manual workarounds, unmanaged exceptions, untested assumptions and evidence that only appears when an audit or executive review is imminent.
The second signal is proportionality. Weak organisations either ignore the topic until something breaks or turn it into a heavy process that teams route around. Stronger organisations know where the topic matters most, where a lighter control is enough and where additional evidence is justified by risk.
Diagram Concept
The current topic diagram is a relationship map. A mature diagram for this page should show the operating boundary created by Observability: the decision points, ownership handovers, evidence loops, escalation routes and related concepts that make the idea inspectable. The visual should help a leader ask better questions and help an engineer understand what changes in delivery.
Related Topics
Start with DORA Metrics, Operational Flow, Operational Governance. These relationships are deliberately practical: they show where this topic changes an adjacent architecture, governance or delivery conversation.
